Effectiveness Testing
What do we mean by "Directionally Reflects" Radiation?
Our phones emit their radiation in all directions, using what are called omnidirectional antennas. Most of the exposure we receive has come directly from the cellphone, but small amounts bounce off nearby surfaces, onto us.
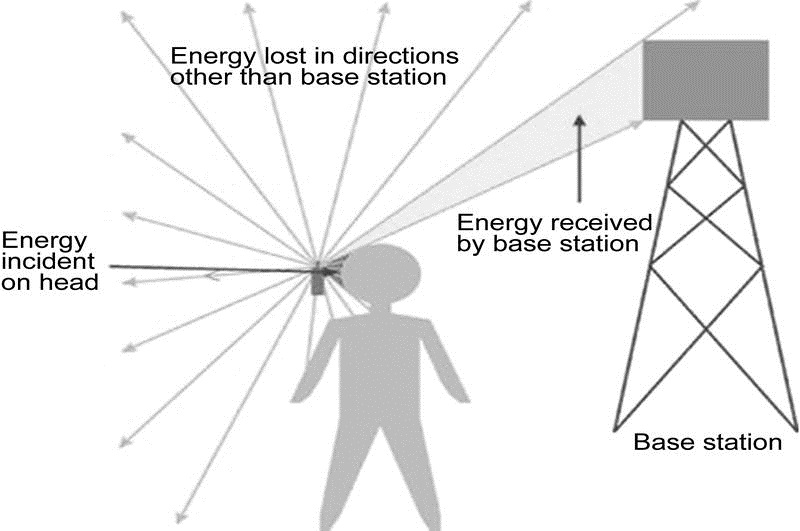
The goal of eFLEKTOR is to reflect the radiation headed directly towards our bodies, while allowing the rest of the signal to flow freely, ensuring the phone continues to function. The solid steel contained inside each eFLEKTOR forms a partition radio waves cannot pass through.
Test Setup
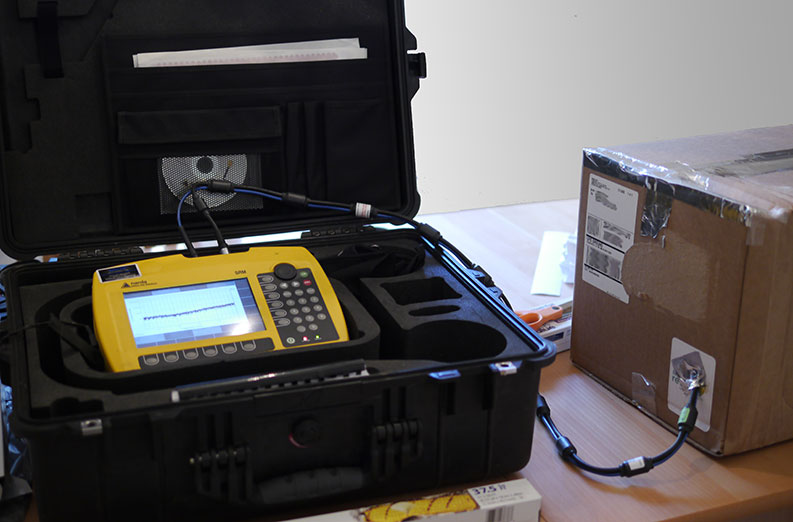
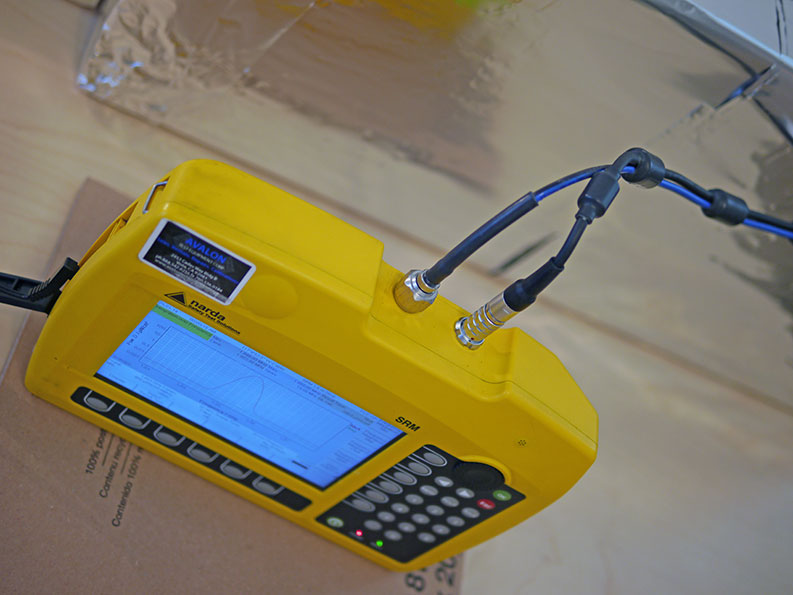
For our test setup, we used a Narda SRM-3006 meter. This is not an inexpensive EMF meter like those available off Amazon - it is a professional-grade tool, with a rigorous calibration routine and schedule. It offers much more precise and repeatable measurements than can be obtained by consumer grade tools.
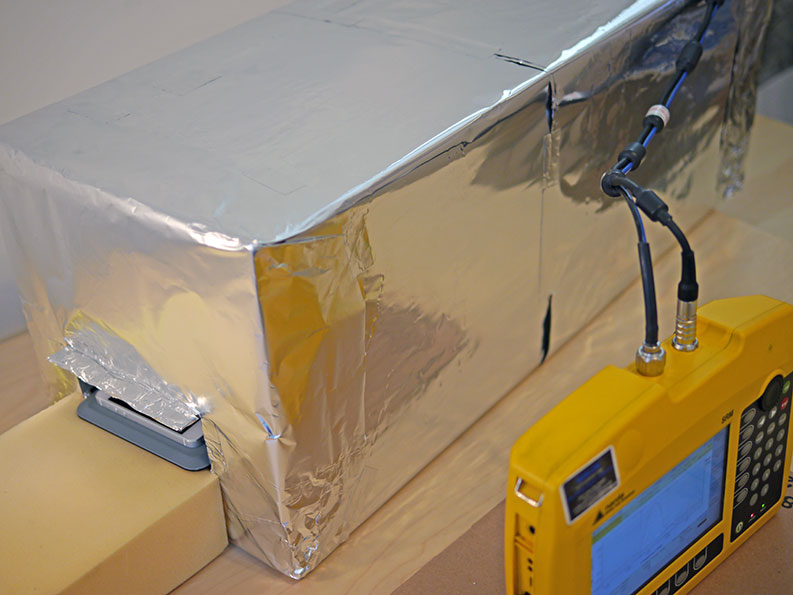
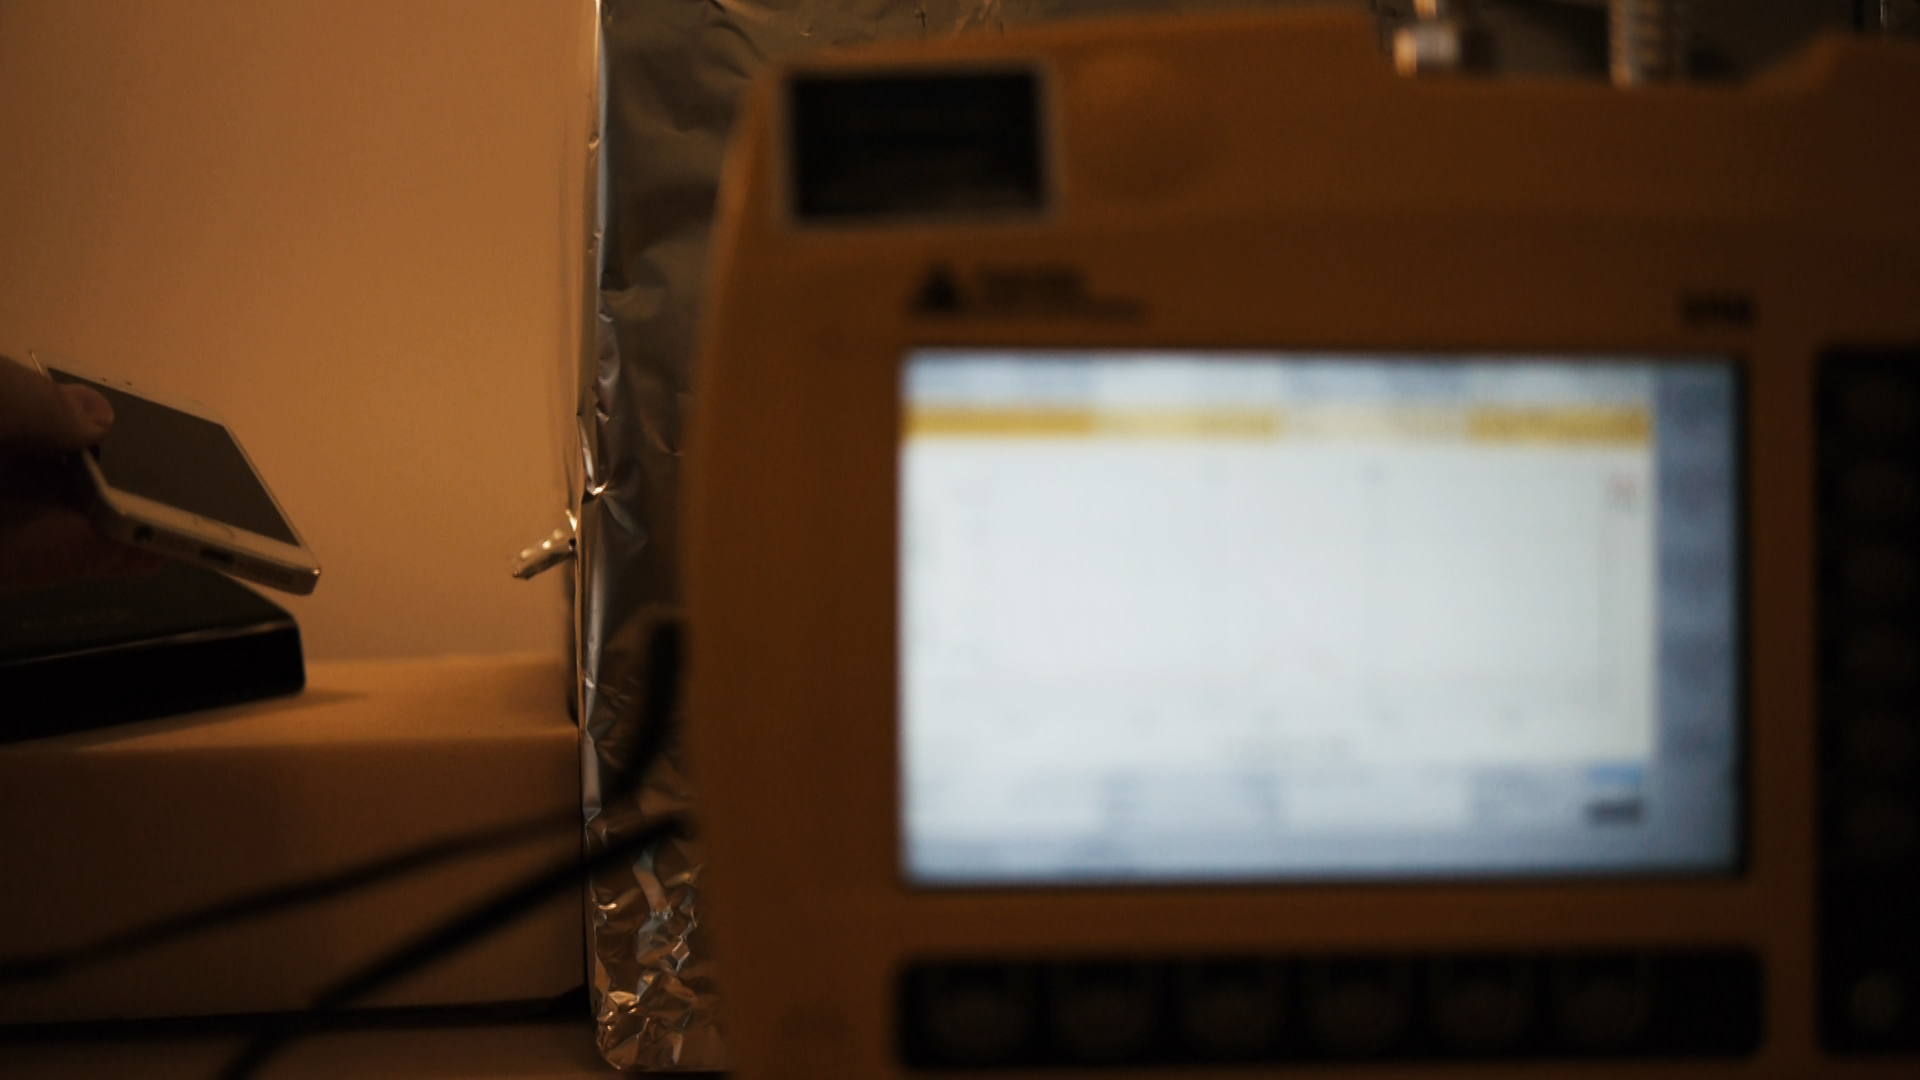
The meter's antenna was placed inside a Faraday cage.
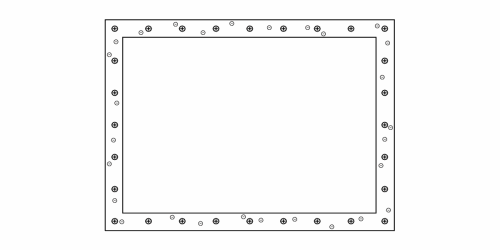
The reason for placing the antenna inside the cage, is to block out any other source of radio signals, that might interfere with the test. This way, the energy recorded by the SRM's antenna, can be sure to have come from our test phone. A large testing facility would have an entire room built as a faraday cage, but for our purposes, usng a large box was sufficient. The box was thoroughly lined inside and out with aluminum foil to provide the Faraday shielding effect. Picture below shows a cutaway after testing was complete, of how the components were arranged inside the box.
The Narda meter was attached to the antenna, and the entire test platform arranged to facilitate filming the test procedure.
A small door was cut into the side of the box. This served two purposes - one, it would allow for us to place and remove the eFLEKTOR to show the difference it makes in absorbed energy. Two, it would allow the phone to have some signal. If the phone was placed inside a completely closed Faraday cage, it would not be able to communicate with nearby cell towers, and would not transmit as it normally does. We needed the phone to send and receive data just as it would on someone's desktop or bedside table.
This test was conducted in an upstairs room in a typical suburban home. This room has very good cell reception, so the phone didn't have to "work very hard" to maintain a quality signal. In testing in this room, the phone's peak output was only about 1/10th what we'd seen it do in more difficult areas.
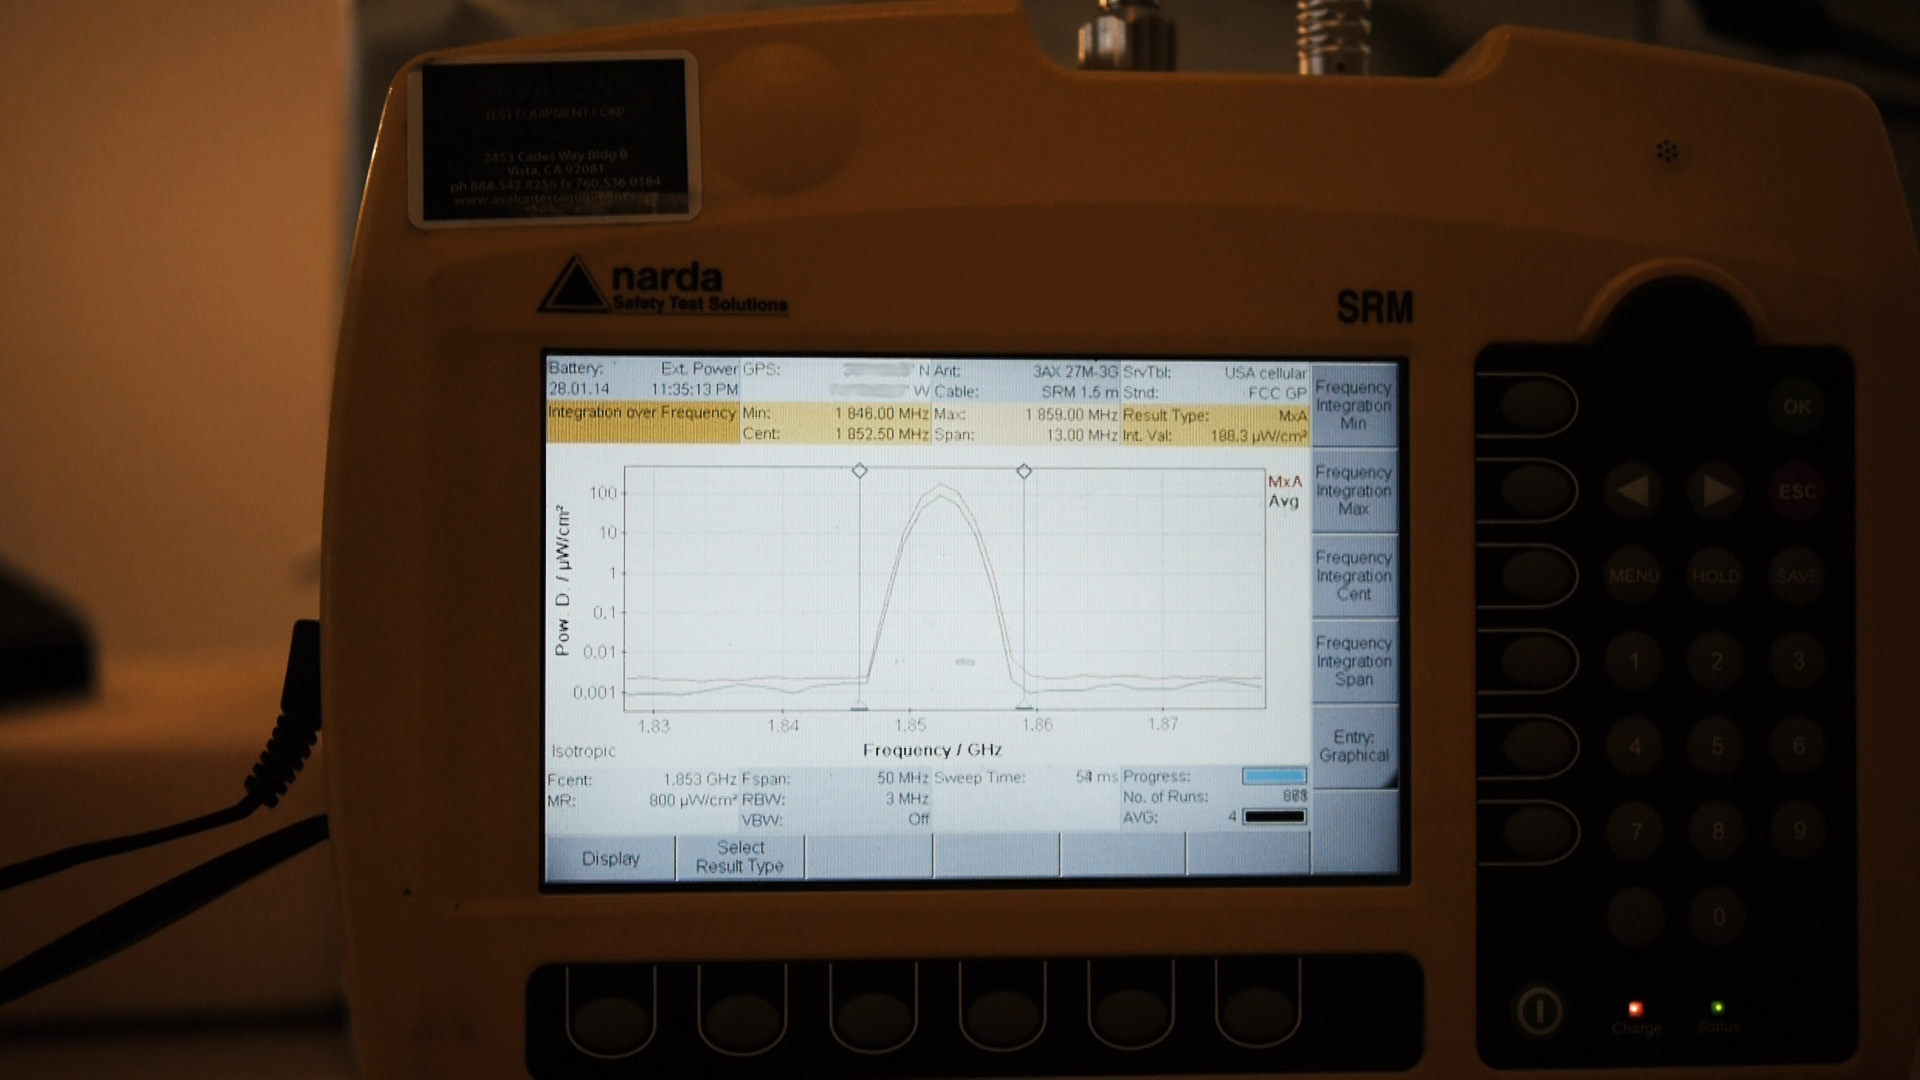
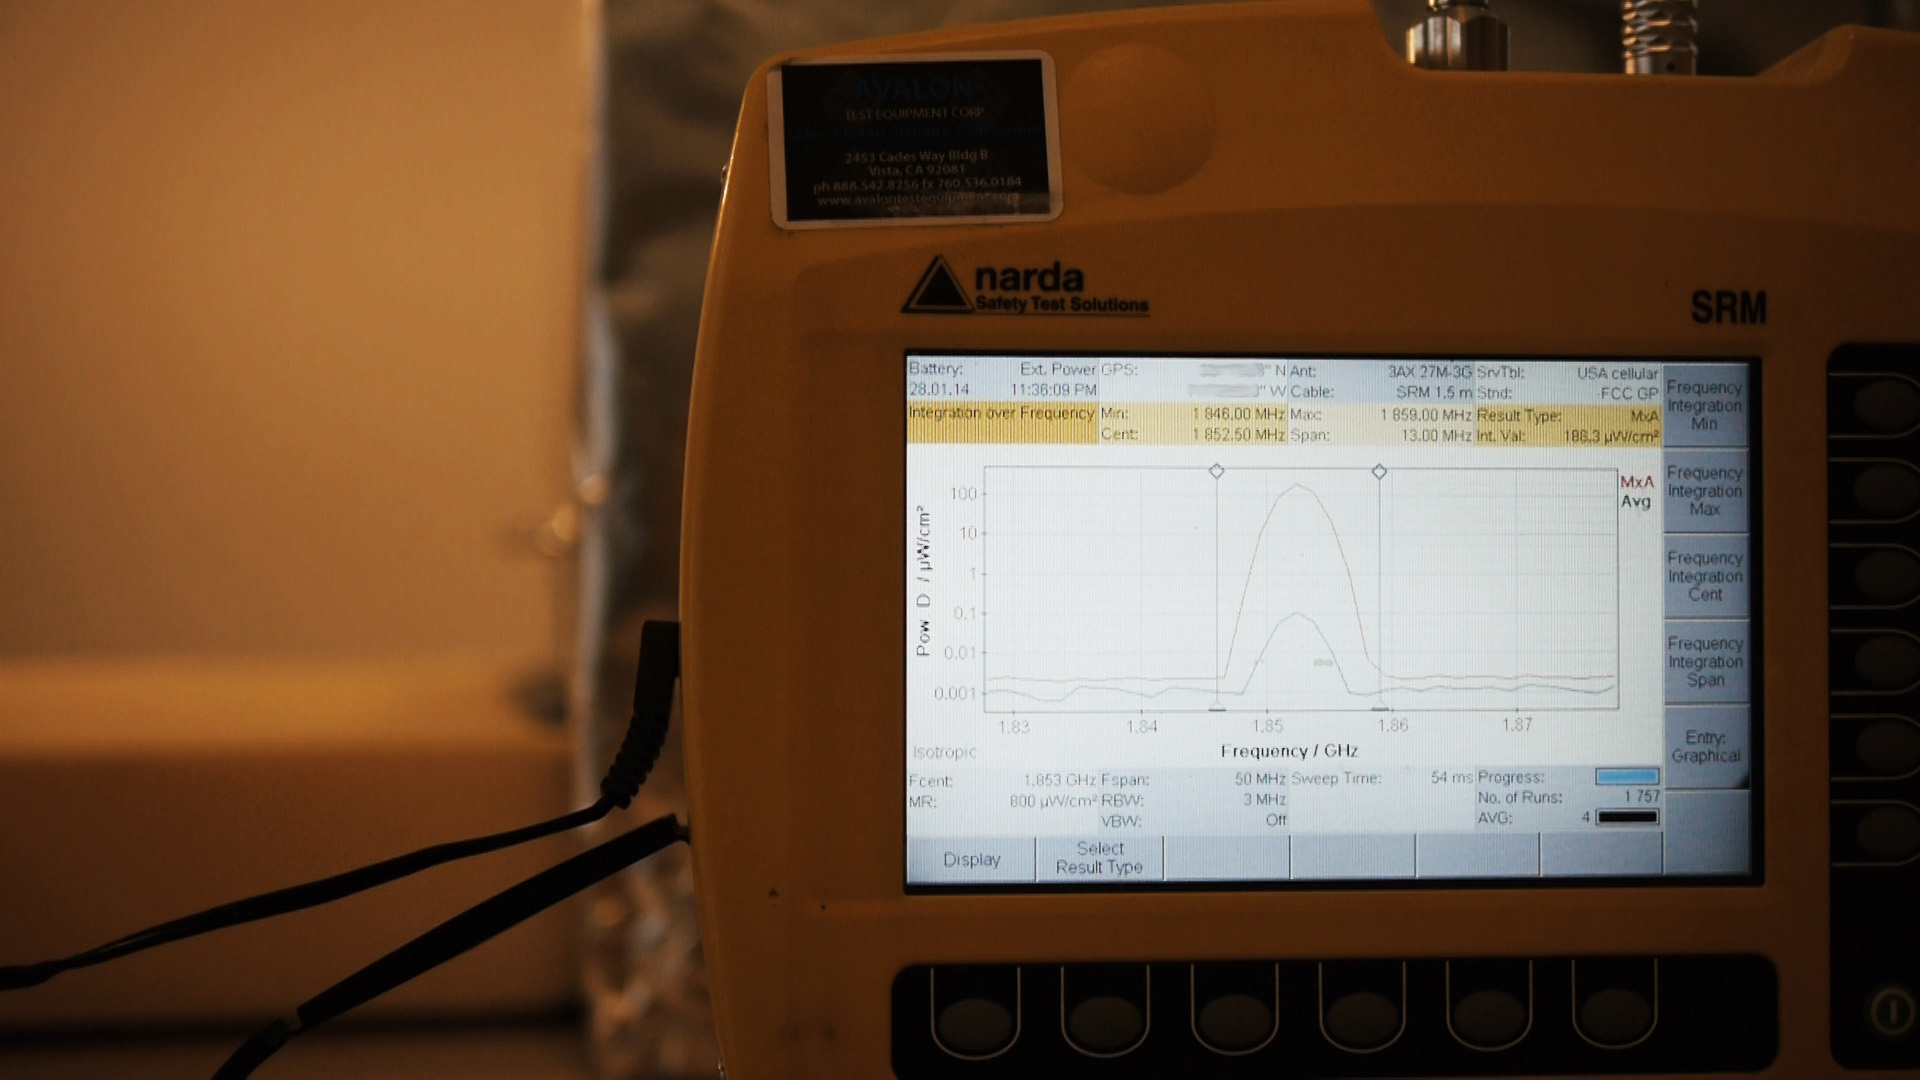
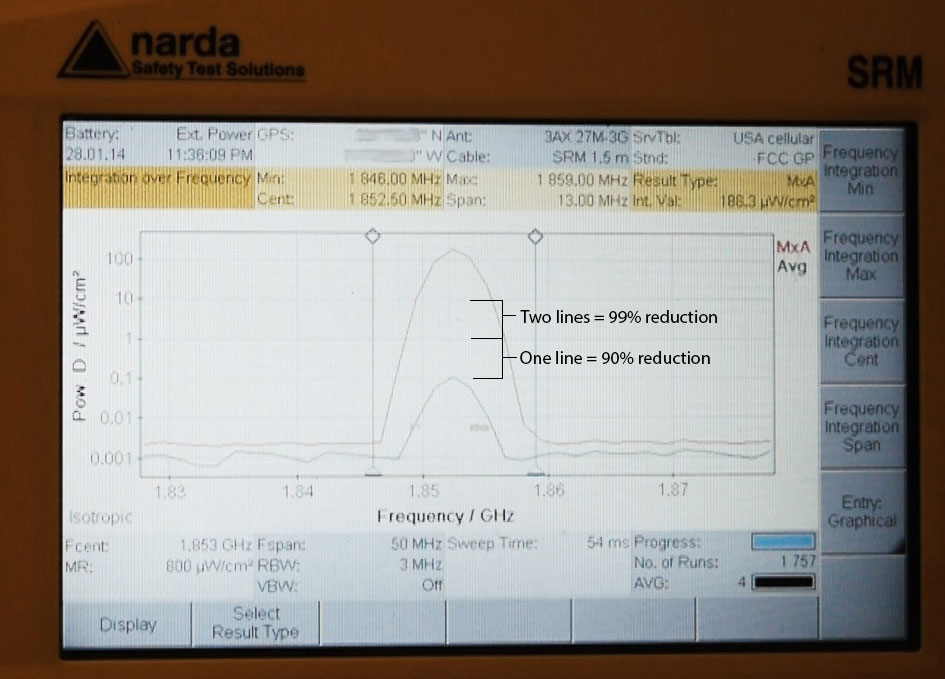
The meter's values are displayed on a logarithmic scale. Briefly, a logarithmic scale is used to show a very wide range of numbers; each horizontal line represents a 10x change in reading. This is shown by the Y-axis labels for power measurement - instead of increasing by a constant number, they go 0.001, 0.01, 0.1, 1, 10, 100. Each step up is 10x the power. Conversely, each step down, is 1/10th the power. The Narda has a very detailed GPS in its readout which we have intentionally blurred. Showing it would be like displaying an address, which we would like to keep private.
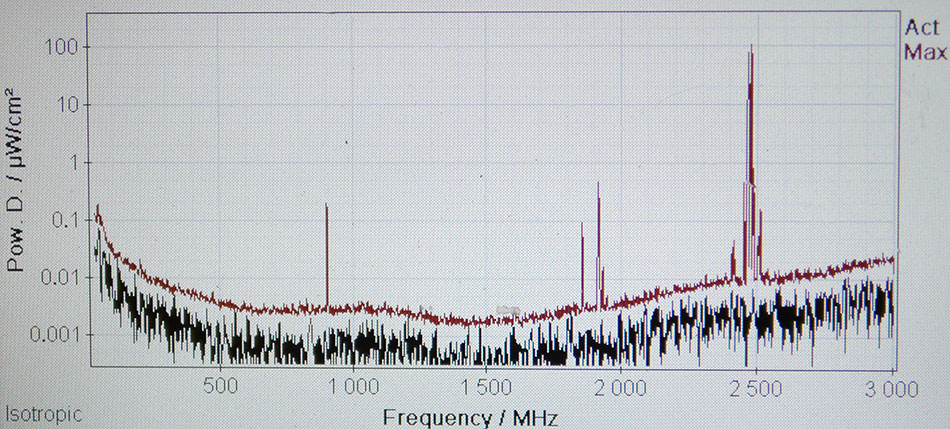
The above values were recorded around the house with the meter. The 100µW/cm² spike at 2450 MHz is what was recorded with the meter up against a running microwave oven.
Testing Procedure
We are in the process of producing the video showcasing one pass of the entire test process. An explanation of the test procedure with screen captures from the video are below. In the video and these photos, a small area of the screen is intentionally blurred.
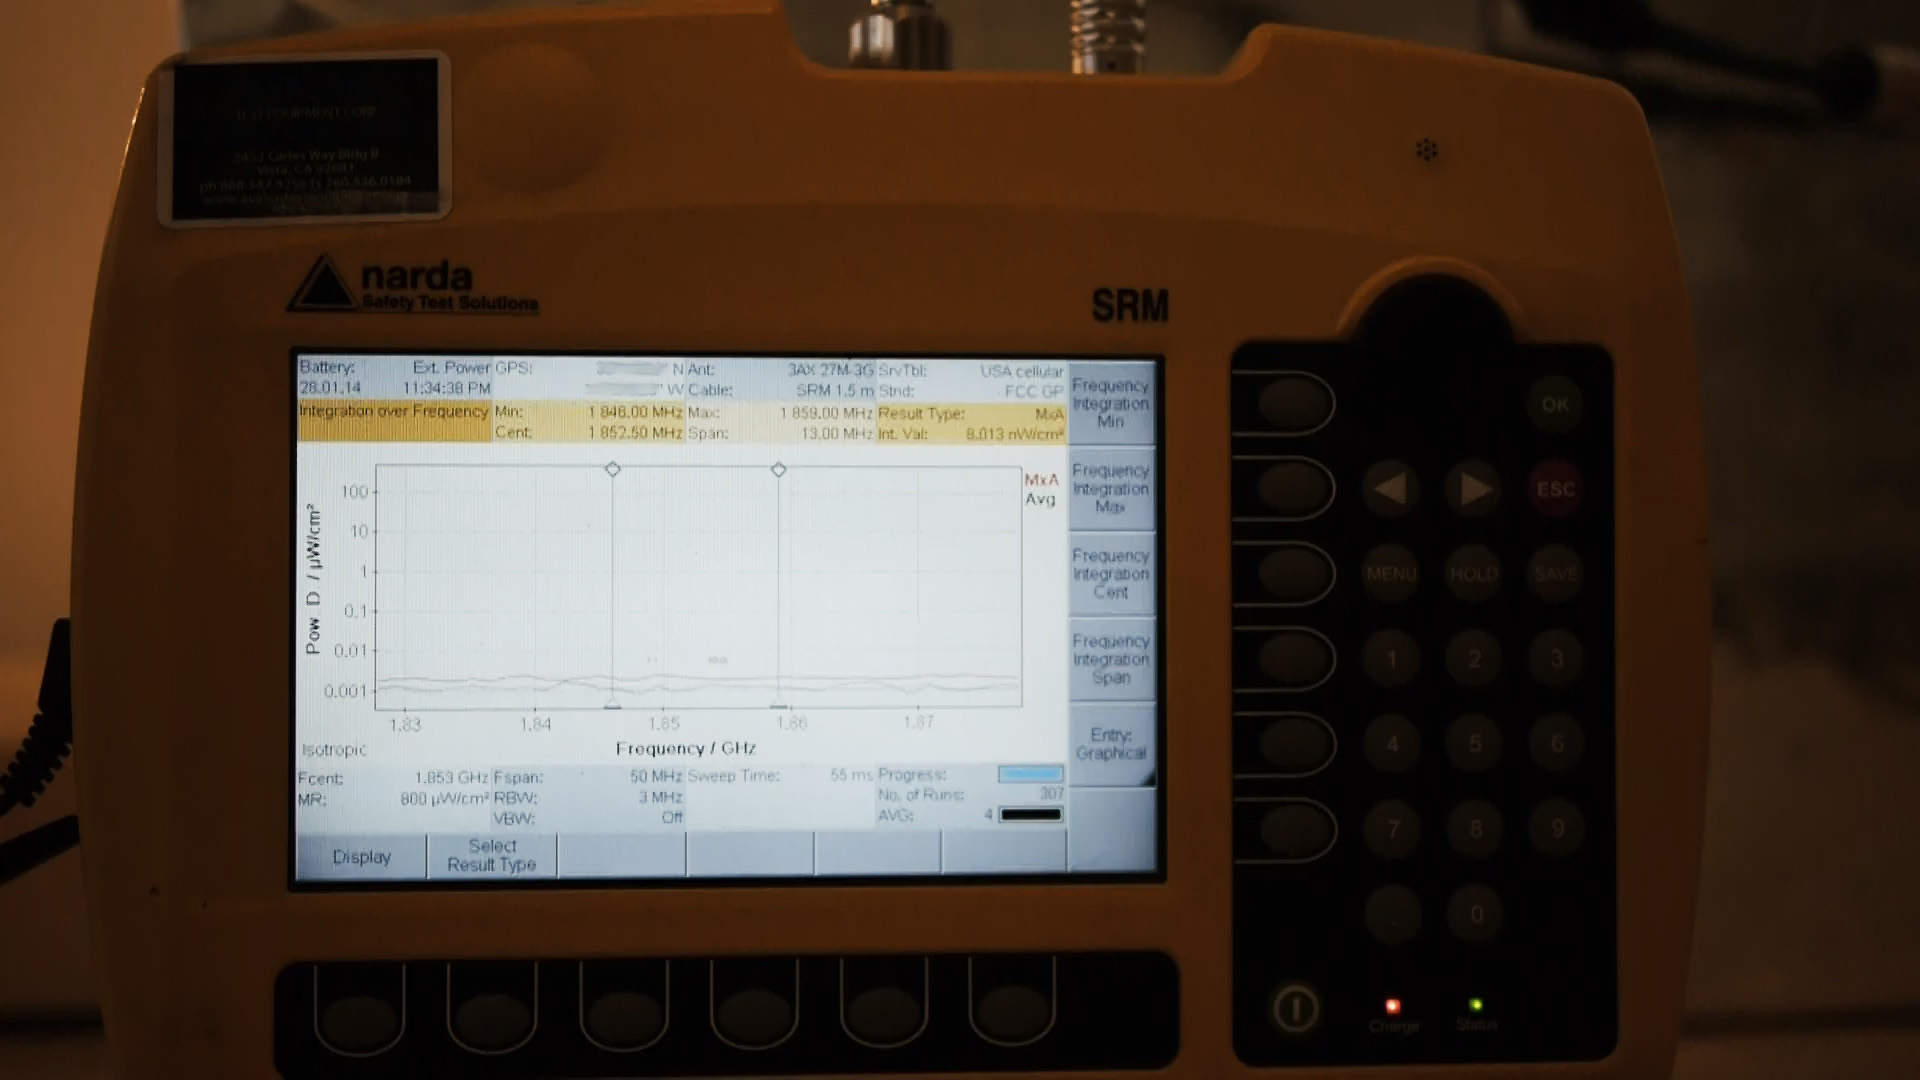
- Step 1 was to power up the Narda meter and get it set correctly. The meter will be displaying two lines - the black line is a time-smoothed average; the red line shows the "Maximum Average" along the frequency spectrum.
As a baseline, the meter reads about .001 µW/cm². We know the frequency this particular phone uses, and have the meter centered around this range.
- Step 2 was to place a phone at the opening of the Faraday cage. The phone was set to transmit some large email attachments, so we could be certain it would be transmitting for the duration of the test.
- Step 3 we review the output being produced by the phone. We see the red line (max average) has gone over 100µW/cm². This is 100,000x the energy we saw at baseline, and about the same as we saw from our microwave oven above. The black line at this moment is right at 100µW/cm², a representative average for the recording period. In the video it can be seen how the instantaneously measured value undulates just above and below this figure.
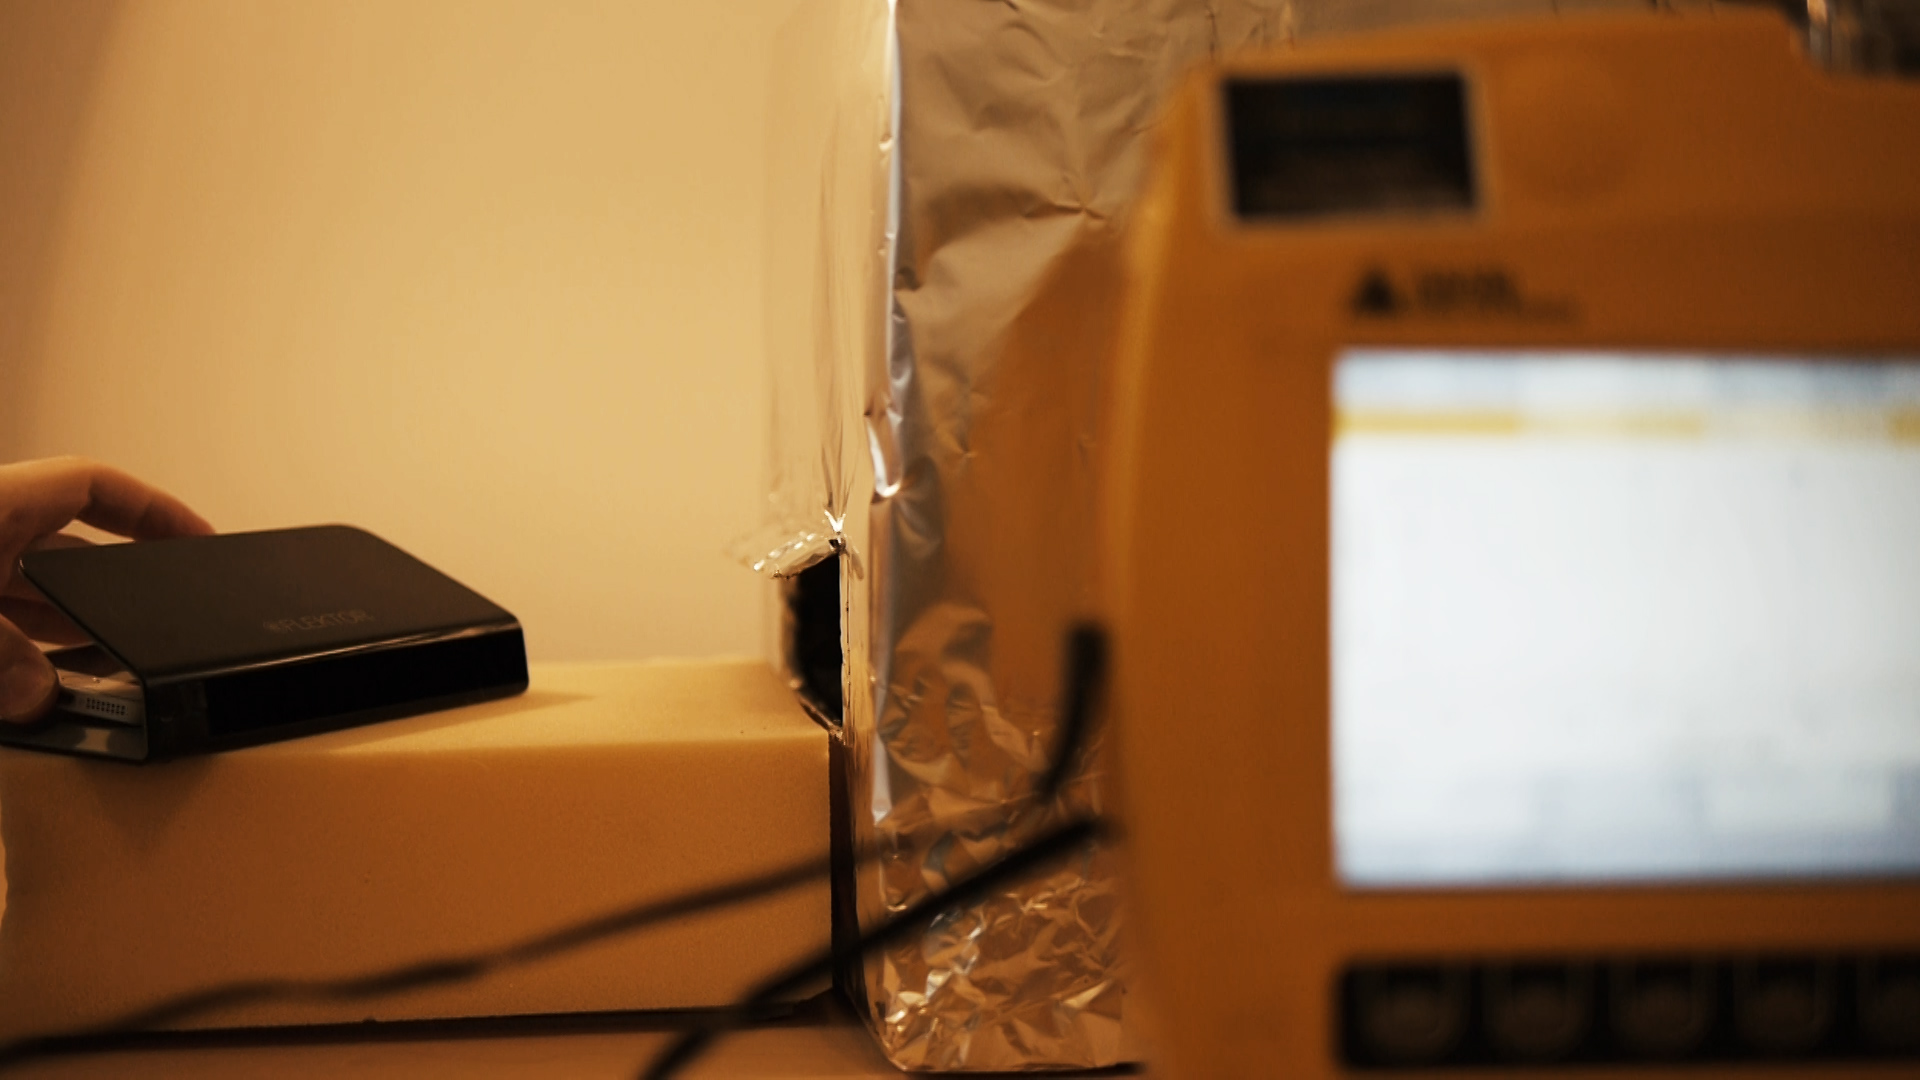
- Step 4 we remove the phone, and return it to the same position in the box, this time behind an eFLEKTOR. The eFLEKTOR pictured is a production unit off the assembly line, not a special prototype.
- Step 5 we review the new power readings, now that the phone is behind the eFLEKTOR. In this shot the meter is reading .1µW/cm², a representative value for the recording period.
Test Results
Without an eFLEKTOR, the Narda measured energy at a sustained 90-100µW/cm², or 90,000-100,000x baseline, with a peak over 188µW/cm². With the eFLEKTOR in place, measured energy fell in the .1-.5µW/cm² range, with a peak of 1µW/cm². While this is still significantly more energy (100-500x) than we saw with no phone present, it is a massive reduction (over 99%) from the recording with no eFLEKTOR.
This test clearly demonstrates an over 99% reduction in directly emitted radiation.
Why wasn't there a 100% reduction?
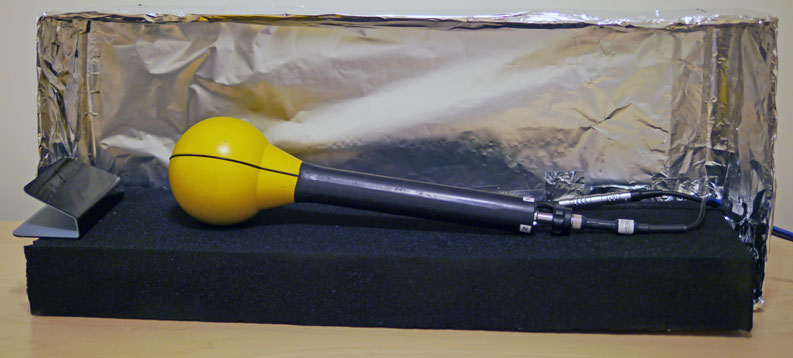
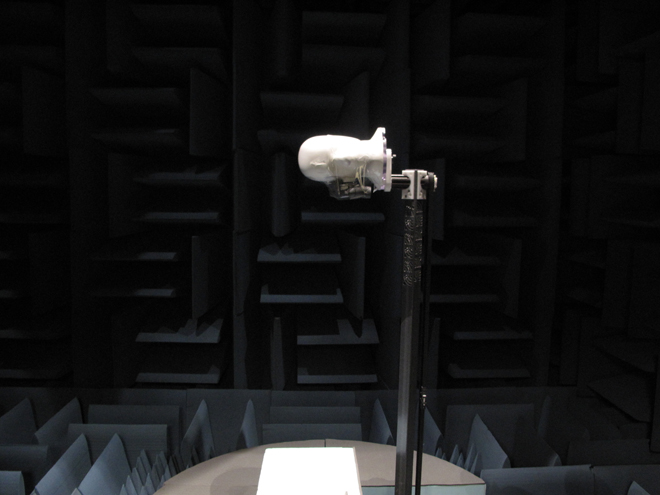
Our Faraday cage allowed for some reflected energy to make it to the meter, a situation that could be avoided in a larger test environment, like the one pictured below. We believe the direct energy reduction provided by the eFLEKTOR to be much closer to 100% than our "safe" claim of >99%, and are working with third parties to assist in demonstrating this. The photo below is a link to an InfoCenter article describing such a test environment.
Legal Disclaimers: This product is not intended to diagnose, treat, cure, or prevent any disease.